Using the Portal:
Please Note: The data portal takes a few moments to load so please be patient when using the portal. If the portal does not load correctly or you experience issues when using it, please refresh your browser.
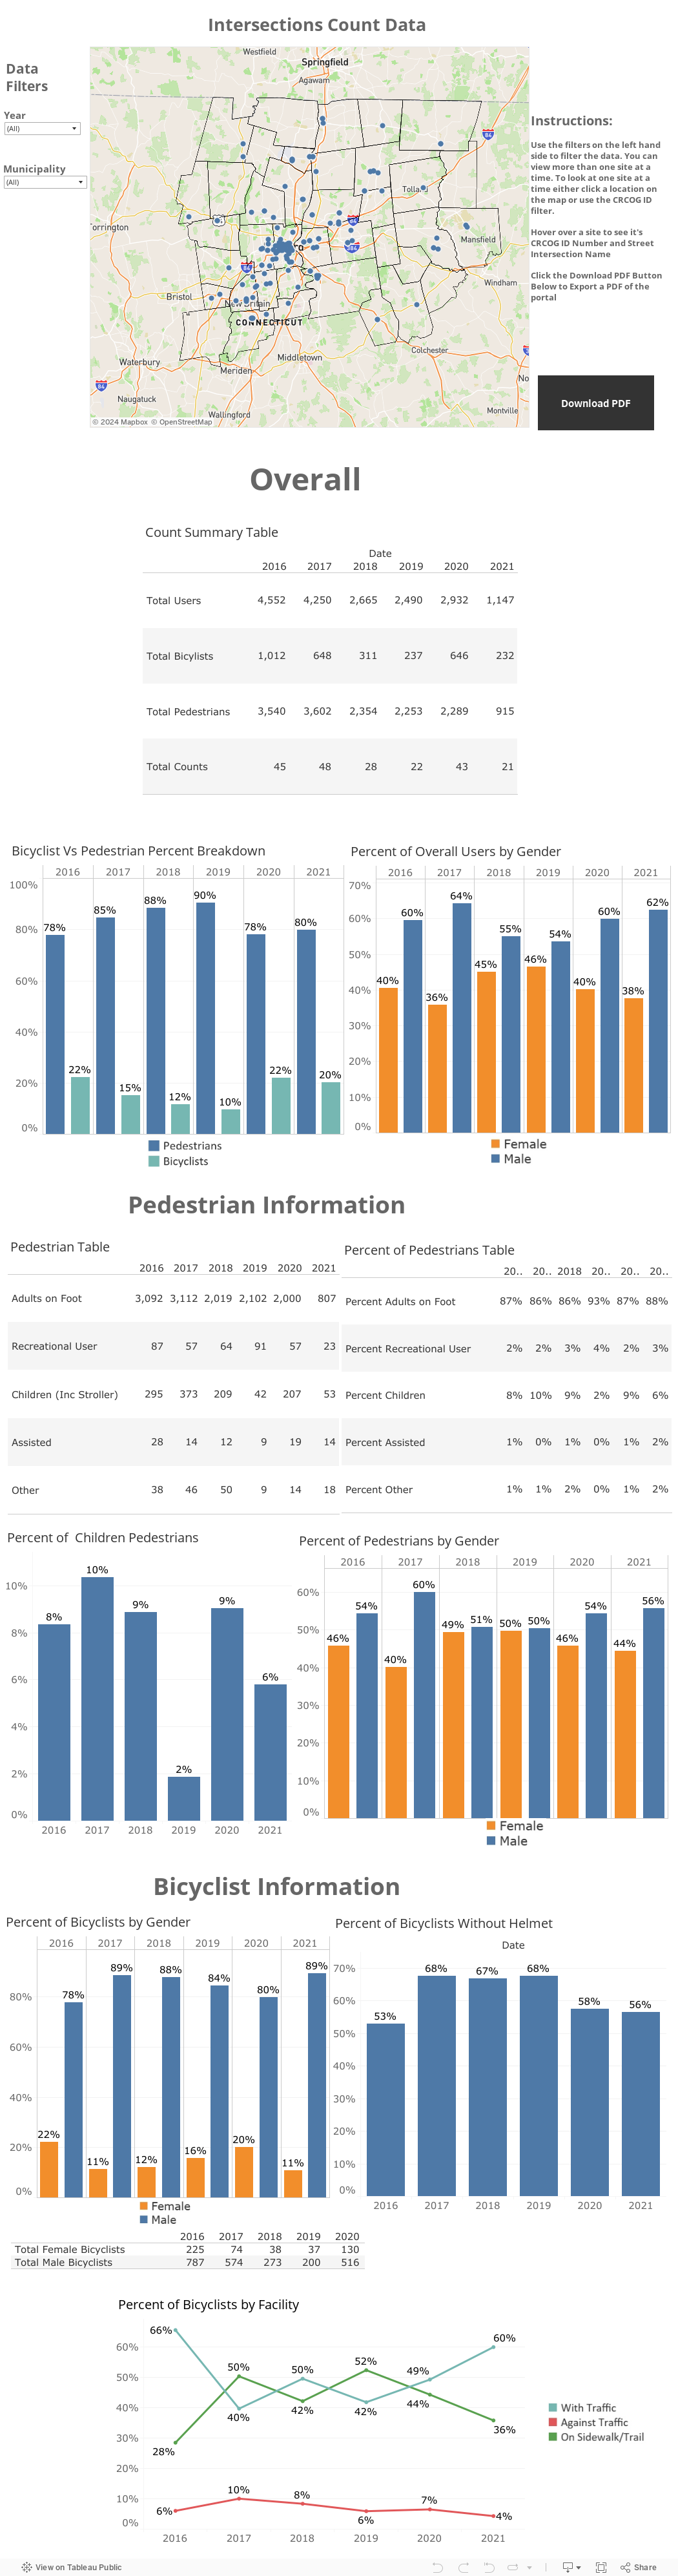
The Bike-Ped count data is separated into two portals, one for counts taken at intersections which is labeled “Intersection Counts” and the other for screenline counts labeled “Screenline Counts”. The portal allows you to see data in aggregate for all counts but also filter by municipality and specific selected sites. The data is broken down into various charts and tables to help users quickly analyze the data.
The last tab labeled “Downloading Data” allows you to download the Bike-Ped count data in Excel format. Downloads are available for all the counts; intersection counts, screenline counts, and also by each municipality.
Count Methodology:
In September 2009, CRCOG participated for the first time in the National Bike/Ped Documentation Project (NBPD), a project sponsored by the Institute of Transportation Engineers and co-sponsored by Alta Planning + Design. The nationwide effort provides a consistent model of data collection and ongoing data for use by planners, governments, and bicycle and pedestrian professionals. The purpose of the project is to encourage agencies nationwide to start conducting bicycle/pedestrian counts and surveys in a consistent manner similar to motor vehicle counts. Working in conjunction with the NBPD, we modified the count and instruction forms to represent our region. The purpose of participating in the NBPD was to initiate a bicyclist/pedestrian data collection program for the Capitol Region.
After reviewing guidance issued by the NBPD, CRCOG staff determined that two kinds of counts would be performed based on the location: intersection counts and screenline counts (mainly on trails and bridges) Volunteers stationed at each location counted both pedestrians and bicyclists, rather than separating the two modes. Most of CRCOG’s counts took place between 4pm and 6pm, corresponding to observed peak hours. Intersection counts were overwhelming recorded between 4pm and 6pm on weekdays while Screenline counts were taken 11pm-1pm on weekends. Due to volunteer availability, not all desired locations and times were counted each year. In light of this, results from individual years should not be compared. Not only did the number of count sites vary from year to year, but the actual locations did as well. In some years, for example, a greater percentage of count sites were multi-use trails, while in other years, more on-road counts were done. In accordance with NBPD recommendations, counts are annually conducted in mid-September.
For intersection counts, CRCOG developed forms and detailed instructions that were given to volunteer counters. Both bicyclists and pedestrians were counted and recorded on an intersection diagram. Bicyclists were recorded by the direction they approached the intersection and their destination (turning right, going straight, and turning left.) Counters also recorded if a bicyclist was traveling the wrong way or riding on the sidewalk. Helmet use by cyclists was recorded as well. Pedestrians were counted as they crossed the intersection and recorded for the appropriate crosswalk. Diagonal crossings by pedestrians were also recorded. Counters also recorded basic demographic data such as sex and age (adult or child). Counters were also asked to record whether or not pedestrians used an assistive device such as a cane or a wheelchair.
Screenline counters tracked bicyclists and pedestrians who passed an imaginary line across the trail or roadway being counted. the majority of these counts were conducted on multi-use trails. These counters used different forms but recorded the same information (except for turning data).
Notably, in 2017, CRCOG began a new three-year rotation of data collection so every three years the same sites would be counted. In 2020 many of the same sites counted in 2017 were counted again. These cycles are as follows, 2017-2020, 2018-2021, and 2019-2022. This new rotation allows comparisons within years that strived to count the same sites. Yet, as mentioned earlier, please be mindful when even comparing the data from three-year rotations like 2017-2020 in aggerate due to varying volunteer availability and certain years having intersection or screen line counts taken place.
CRCOG strives to continue this project and keep counting levels up. This data portal will be updated every year as new data is made available. The plan is for this data portal to become a library of Bike-Ped counts conducted within the region. We envision the platform to be used by municipalities, volunteers, and other stakeholders to quickly access the counts and perform analysis either by using the portal or downloading the data in excel spreadsheets.

Click on the links below to be open an online excel spreadsheet where you can download the count data in excel format.
Counts by Municipality:
- Andover:
- Avon:
- Berlin:
- Bloomfield:
- Bolton:
- Canton:
- Coventry:
- East Granby:
- East Hartford:
- East Windsor:
- Ellington:
- Enfield:
- Farmington:
- Glastonbury:
- Granby:
- Hartford:
- Hebron:
- Manchester:
- Mansfield:
- Marlborough:
- New Britain:
- Newington:
- Plainville:
- Rocky Hill:
- Simsbury:
- South Windsor:
- Southington:
- Stafford:
- Suffield:
- Vernon:
- West Hartford:
- Wethersfield:
- Windsor Locks:
- Windsor: